
Every organisation captures safety data. But how often do you step back and look at what that data is really telling you?
Health and safety incident reporting isn’t just a compliance requirement – it’s your most valuable tool for understanding risk, identifying trends, and preventing serious harm. It’s the foundation of workplace safety.
Done well, it transforms reactive safety management into proactive prevention.
Our m2i.SHEQ software help businesses record, track and analyse their safety events – from minor near misses to serious RIDDOR-reportable incidents. Over time, patterns emerge. And those patterns can reveal where your risks really lie, where your reporting culture is strong, and where there’s work to do.
In this blog, we’ll look at typical data gathered from m2i.SHEQ users and explore what effective health and safety incident reporting can tell you about your workplace.
The reality of workplace injuries
When we analyse injury events captured through consistent health and safety incident reporting, a clear picture emerges. Our data relates primarily to the utilities, housebuilding and construction sectors.
| Injury Outcome | Incidence |
| No Lost Time | 57% |
| Lost Time | 27% |
| Over 7-Day | 7% |
| Specified Major | 6% |
| Member of Public (MOP) | 1% |
The headline? The majority of recorded injuries (57%) don’t result in lost time.
That’s encouraging. It suggests many incidents are minor. But it also raises a question: are these events being captured because of a strong reporting culture, or are more serious injuries going unreported?
The 27% of injuries that do result in lost time represent a significant operational and human cost. And the 6% classified as specified major injuries are the incidents no organisation wants – but every organisation needs to learn from. Indeed, although the stats don’t record it, this data includes one fatality – which presents a huge emotional cost for any organisation, not to mention the financial and legal risk.
This is where the quality of your health and safety incident reporting matters most. Without accurate, consistent data, you’re working blind.
Breaking down RIDDOR categories
Looking at the same injury events through the lens of RIDDOR (Reporting of Injuries, Diseases and Dangerous Occurrences Regulations), we see:
| RIDDOR category | Incidence |
| Lost Time Incident | 35% |
| First Aid | 22% |
| Specified RIDDOR | 17% |
| 7-Day RIDDOR | 17% |
| Near Miss | 4% |
Over a third of recorded injuries result in lost time. That’s time off work, disruption to projects, and potential costs – both financial and reputational.
The combined 34% of Specified RIDDOR and 7-Day RIDDOR incidents highlights the regulatory burden that comes with serious injuries. These are the events that require formal reporting to the HSE, investigation and documented corrective action. Robust health and safety incident reporting ensures nothing falls through the cracks when regulators come calling.
Perhaps most notable is the low percentage of near misses (4%) within this dataset. Near misses aren’t often recorded in RIDDOR data. In a mature safety culture, we’d typically expect to see near misses significantly outnumber actual injuries – often by a ratio of 10:1 or higher. A low near-miss rate doesn’t mean near misses aren’t happening; it usually means they aren’t being reported.
Non-injury events: where prevention begins
Effective health and safety incident reporting goes beyond injuries. Non-injury events are often your best opportunity to intervene before someone gets hurt.
Looking at non-injury events recorded through m2i.SHEQ:
| Non-injury event type | Incidence |
| Minor Damage | 55% |
| Near Miss | 35% |
| High-Potential | 10% |
Over half of non-injury events involve minor damage – to equipment, property or materials. These are often dismissed as “just one of those things”, but they’re valuable leading indicators. A pattern of minor damage events can point to systemic issues: poor housekeeping, inadequate training or equipment problems.
The 35% recorded as near misses is more encouraging. These are the events that could have resulted in injury but didn’t. Capturing them through consistent health and safety incident reporting is critical – every near miss is an opportunity to intervene before someone gets hurt.
The 10% classified as high-potential events deserve particular attention. These are the near misses or non-injury events that, under slightly different circumstances, could have resulted in serious harm. They warrant thorough investigation and robust corrective action.
What can we learn from better Health and Safety incident reporting?
1. Your reporting culture shapes your data
Low near-miss numbers relative to injuries often indicate under-reporting rather than a safe workplace. If your people aren’t reporting near misses, you’re missing your best opportunity for prevention.
Ask yourself: Is it easy for workers to report incidents and near misses? Are they encouraged to do so? Is there a blame culture that discourages reporting?
2. Minor events are major opportunities
Minor damage and no-lost-time injuries are easy to overlook. But they’re your early warning system. A spike in minor events often precedes a serious incident – but only if your health and safety incident reporting captures them.
Ask yourself: Are you tracking trends in minor events? Are you investigating them with the same rigour as serious incidents?
3. RIDDOR events demand attention – but shouldn’t be your only focus
Specified RIDDOR and 7-day reportable injuries are serious, and rightly receive attention. But if your safety programme is only reactive – focused on the incidents you must report – you’re always playing catch-up.
Ask yourself: What’s your ratio of leading indicators (inspections, near misses, observations) to lagging indicators (injuries, RIDDOR reports)? A healthy ratio suggests a proactive safety culture.
4. High-potential events are your biggest red flags
That 10% of high-potential non-injury events? Those are the incidents that nearly became headlines. They deserve the same investigation and corrective action as actual injuries – and they should be a priority in your health and safety incident reporting process.
Ask yourself: Do you have a process for identifying and escalating high-potential events? Are lessons learned being shared across your organisation?
Why digital health and safety incident reporting makes the difference
None of these insights are possible without consistent, accurate recording of safety events.
Paper-based systems, spreadsheets or basic software can capture data, but they make it difficult to spot trends, track actions to completion and share lessons learned. Information gets siloed. Patterns go unnoticed. Corrective actions slip through the cracks.
That’s where digital health and safety incident reporting makes a difference.
With m2i.SHEQ, teams can:
- Report incidents and near misses in real time – from any device, on or off site.
- Categorise events consistently – ensuring accurate, comparable data over time.
- Track corrective actions to completion – with automated reminders and clear ownership.
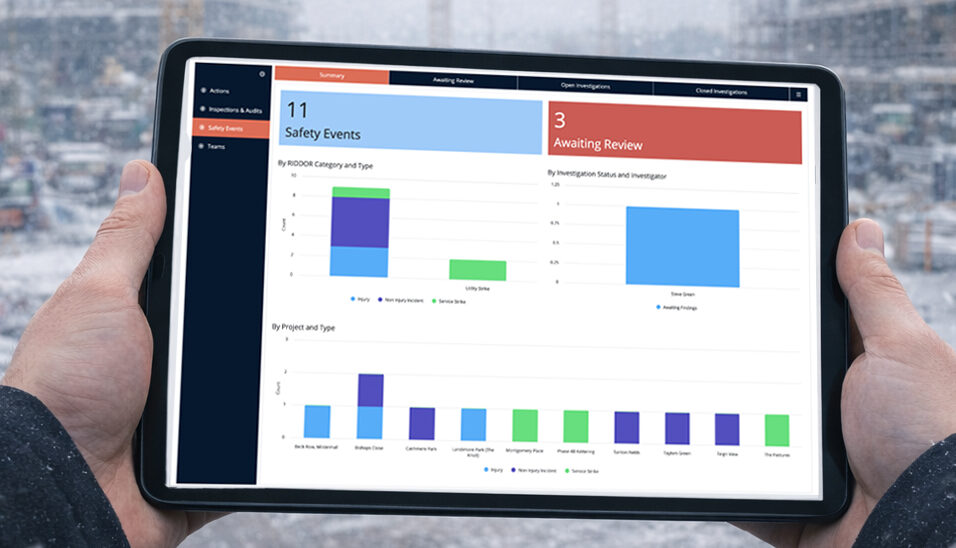
- Visualise trends through dashboards – spotting patterns before they become problems.
- Demonstrate compliance – with a full audit trail for regulators, clients, and insurers.
Whether you’re a small contractor building your safety foundation or a larger organisation refining your approach, the principle is the same: you can’t manage what you don’t measure.
Improve your Health and Safety incident reporting today
If looking at these statistics has prompted questions about your own safety data, that’s a good thing. The first step toward a safer workplace is understanding where you are today.
m2i.SHEQ gives teams everything they need to start their digital safety journey – whether at a small business or major enterprise level – with health and safety incident reporting, action tracking and clear dashboards included from day one.
Ready to see what your data can tell you? Learn more about m2i.SHEQ or book a demo.
A note on the data
The figures in this blog represent typical patterns observed across m2i.SHEQ users primarily in the utilities and construction sectors. Individual organisations will see variation based on their sector, size and reporting culture. In particular, organisations with mature safety cultures often report higher proportions of near misses and lower proportions of injuries – reflecting early intervention rather than fewer hazards.